Outcome Engine Reporting
The Outcomes Engine offers some Excel and Word templates that you can use to report on your outcome engine data. On this page, we provide some examples of the outcome reports and also a downloadable template for you to upload into your account for the “All Fields” report. We also provide some advice about Progress Reporting and connecting data to third-party software.
Examples of Outcome Reports
All Fields template report
Progress Reports
Third-party reporting software
Further help
Please read the pages on Outcomes Engine first
Examples of Outcome Reports
Here are some examples of outcome reports with mock or dummy data to show you what is possible with the Outcomes Engine. The All Fields templates is downloadable in the next section along with instructions on how to run the report in SmartyGrants. The other templates are available upon request.
Project Detail - This is a Word document that provides details about a grantee's project including outcome data.
Demand Report - This is an Excel report that shows applications and funding amount per outcome domain and outcome for a round.
Metrics Summary - This is an Excel report that provides the Grantmaker Metric progress and target data for a selected round.
All Fields - This is an Excel report that provides details across programs and rounds using the outcomes engine default standard sections.
Impact Report - This is a PDF developed using a mixture of Excel charts and Word documents generated by the SmartyGrants reporting function drawn into a third-party report tool (see below re Third Party Reporting).
All Fields Template Report
Here are the instructions on how to download and upload the All Fields template report for Outcomes Engine users.
Download the All Fields template and save it locally.
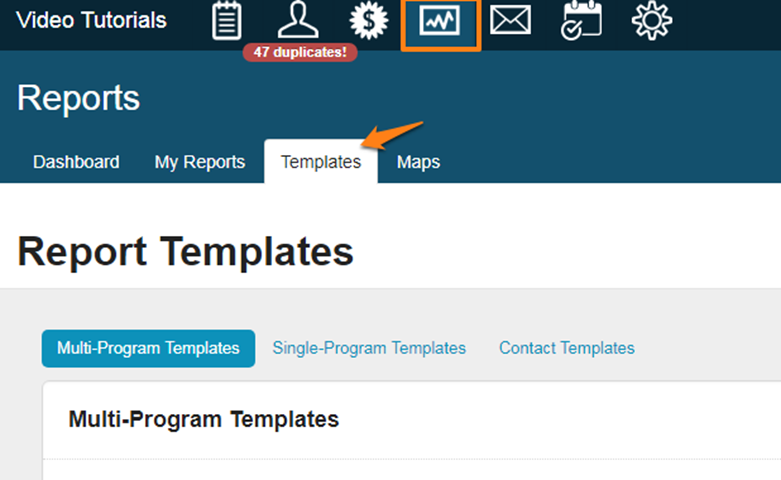
2. Click the Reports icon in the navigation panel at the top of your SmartyGrants screen.

3. Click the Templates tab
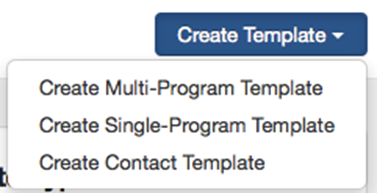
4. Click on the Create Template button and select “Create Multi-Program Template”
6. Name your template “All Fields” and select the “Upload an existing layout file” from the template layout
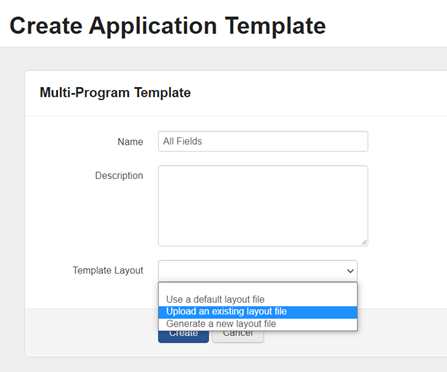
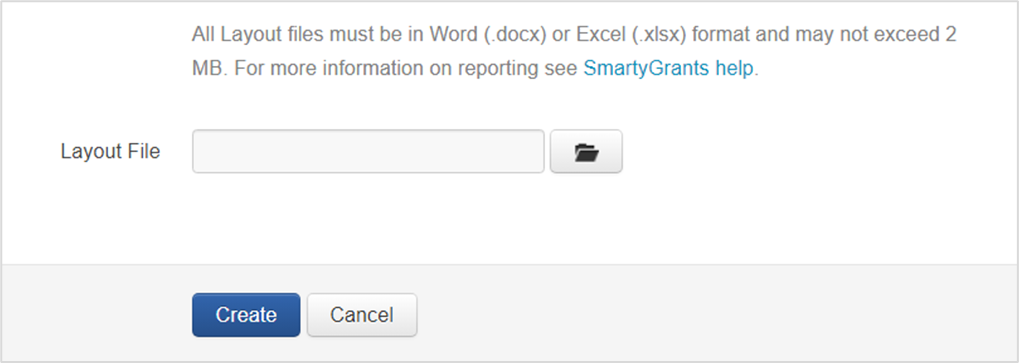
7. Then upload the All Fields Template you saved locally and select create.
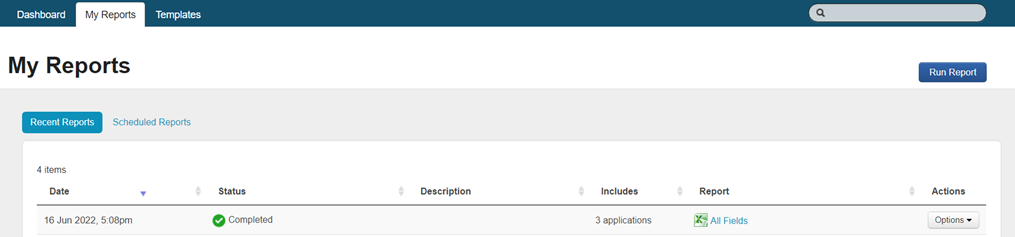
8. Go to My Reports tab and select Run Report
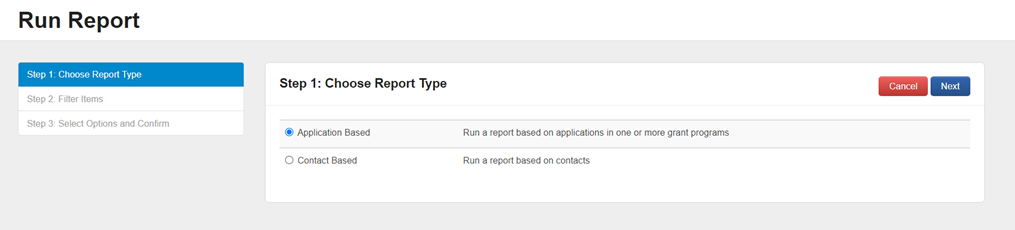
9. Select Application based and Next
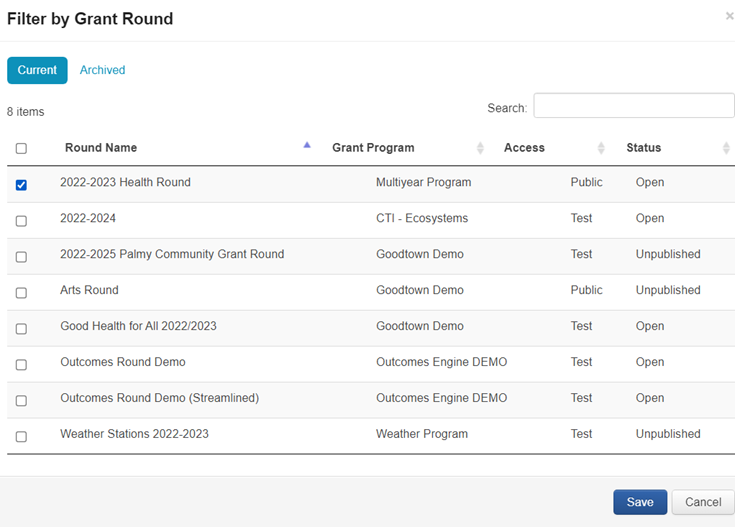
10. Select the round (or any other filter you like such as program)

11. In the pop-up box select the round that you want to run the report on (i.e. 2022-2023 Health Round) and hit SAVE
12. Select Next
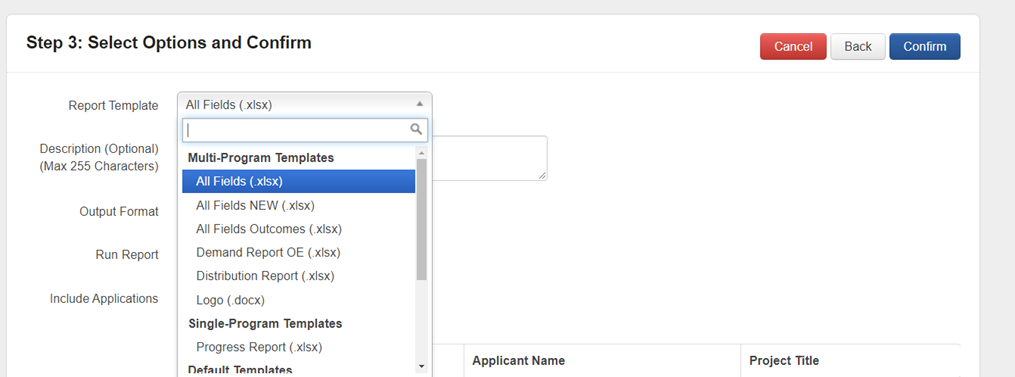
13. In the Report Template drop-down select the All Fields option. Hit confirm.
14. It will now appear in “My Reports” tab. Select the excel to open the report.
Caution – you are downloading data out of the system that may be personal or sensitive information, please follow your Privacy and Security protocols to ensure the data remains secure.
Progress Reports
What is multi-year (quarter/month/week) reporting and when would you want it?
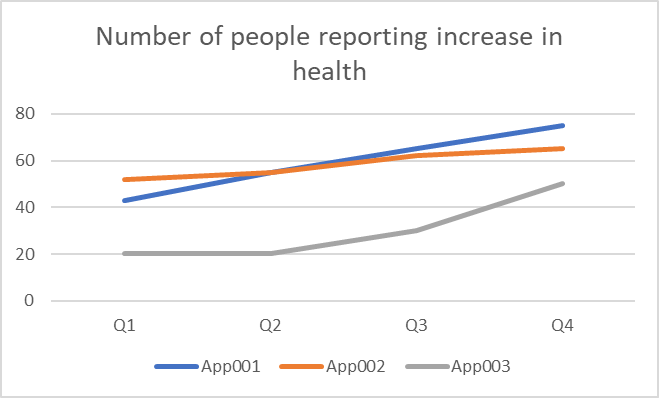
You may require multiple progress reports if the grant goes over 12 months. Collecting multiple data points allows you and the grantee to track progress over time. See the graph below as an example of quarterly reporting of the number of people reporting an increase in health.
The SmartyGrants Outcome Engine provides a ‘progress’ field for Grantseeker and Grantmaker Metrics. However, the field only appears once i.e. there are no progress 1, progress 2, or progress 3 fields.
To create the above graph or table such as these:
| Number of people reporting improvement in health to date | |||||||
| 2022 Q1 | 2022 Q2 | 2022 Q3 | 2022 Q4 | 2023 Q1 | 2023 Q2 | 2023 Q3 | 2023 Q4 |
App0001 | 20 | 50 | 70 | 100 | 120 | 150 | 170 | 200 |
App0002 | 10 | 25 | 50 | 100 | 140 | 160 | 210 | 220 |
or
| Number of people reporting improvement in health per quarter | |||||||
| 2022 Q1 | 2022 Q2 | 2022 Q3 | 2022 Q4 | 2023 Q1 | 2023 Q2 | 2023 Q3 | 2023 Q4 |
App0001 | 20 | 30 | 20 | 30 | 20 | 30 | 20 | 30 |
App0002 | 10 | 15 | 25 | 50 | 40 | 20 | 50 | 10 |
We recommend that you set up your forms in SmartyGrants to support the collection and reporting of this data.
How to set up your forms in SmartyGrants
Create an Application form and use the “Grantmaker Metrics” Standard Section or/and “Grantseeker Metrics” Standard Section. Hide the progress field and other fields if not required.
2. Create a Progress report form and use the “Grantmaker Metrics” Standard Section or/and “Grantmaker Metrics” Standard Section. Hide any fields not required.
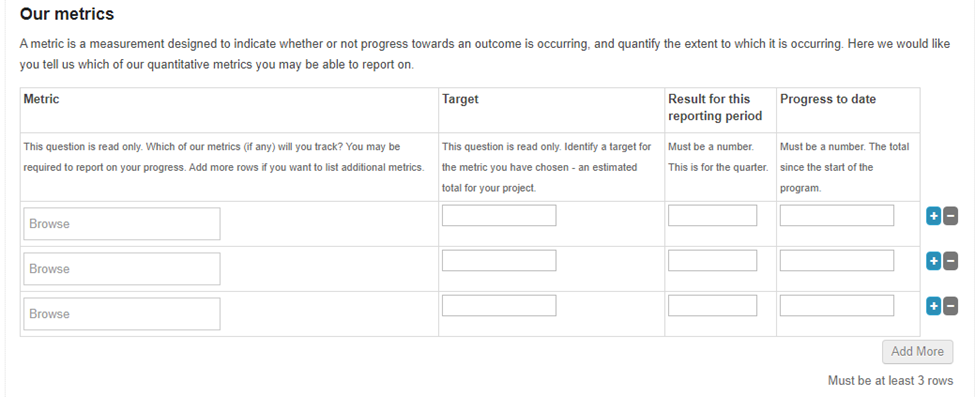
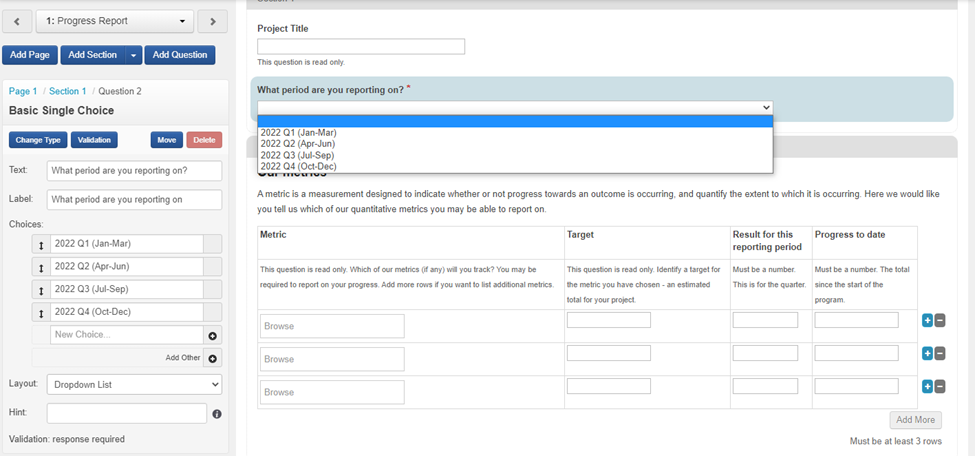
3. Change ‘Progress’ to ‘Progress to date’ and add a “Result for this reporting period” question into the Standard Section. (Why? This helps grantees distinguish between data for the quarter and cumulative data which is what we want in the “progress to date” standard field).
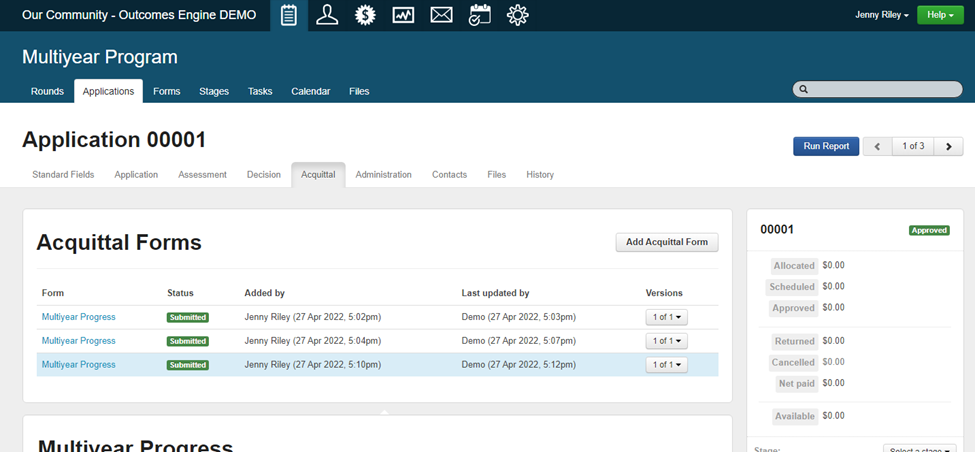
3. Use this ‘Progress Report’ as your standard, that is use it repeatedly. To do this append the same report multiple times to the acquittal tab.
4. So that you know what period is being reported on add a mandatory question “What period are you reporting on?” and add a drop-down menu for the reporting period:
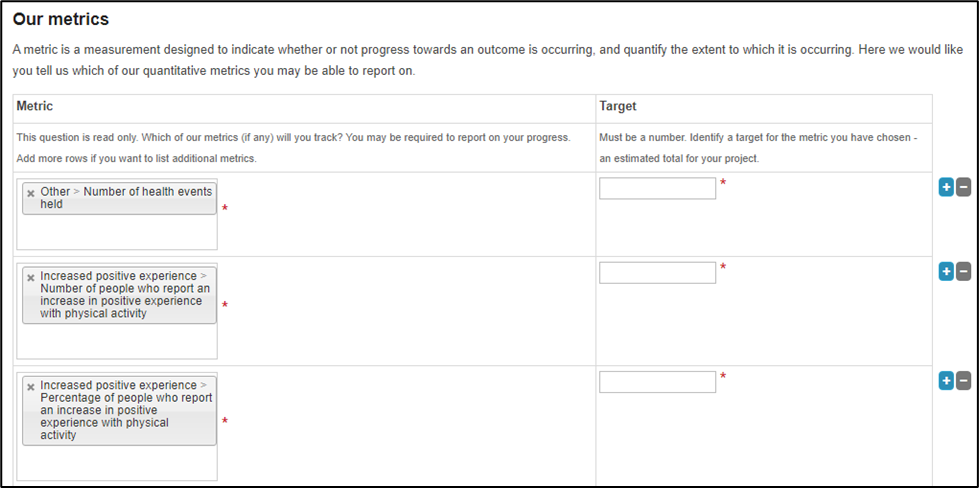
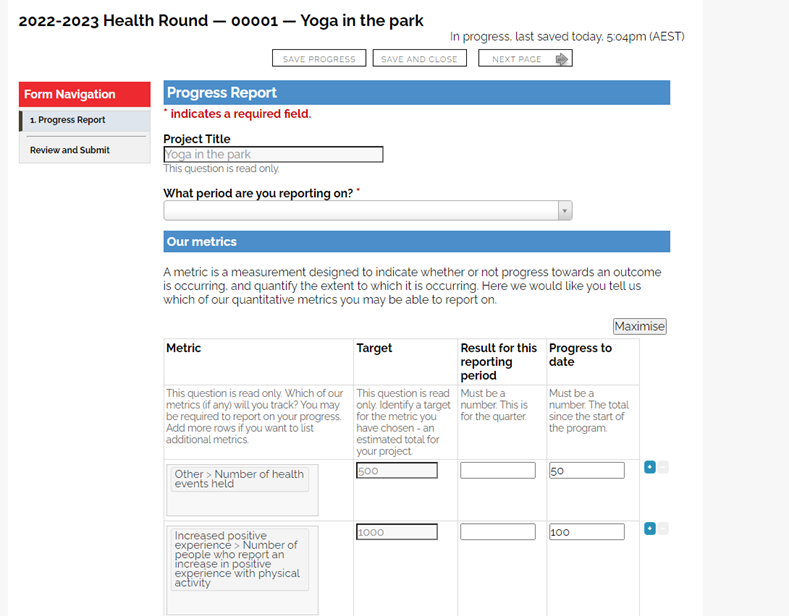
The Progress report form looks like this for the Grantee (note the Target comes across from the application) but the other columns are empty in the first progress report.
When the applicant gets the second progress report, they will need to select the second reporting period AND they will need to update the progress to date data (which will automatically come through from the first progress report).

If the Grantee was reporting 100, 100 and 70 respectively for the Second Quarter it will now look like this:
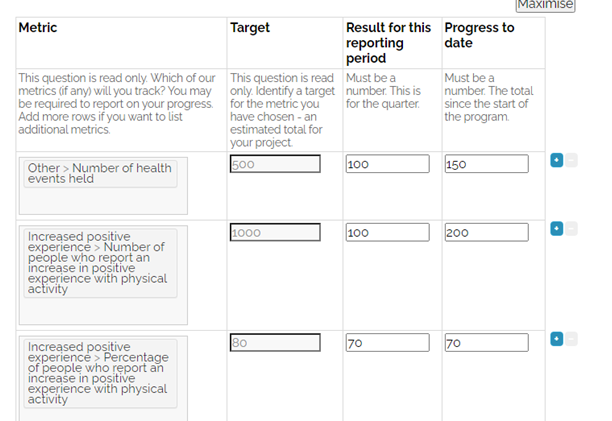
NB: They will have to manually calculate the progress but this is progress to date plus the new data i.e. 100 (last progress to date) plus 50 for this quarter = 150 progress to date.
How to produce a progress report?
Download this template
2. Upload this template and run the report (see the first 5 steps in the All Fields Report above on how to upload a template).
NB: To update the template to do monthly report or 6-monthly reporting go to Customise Template (scroll down to Excel templates)https://help.smartygrants.com.au/using-smartygrants/reports-and-correspondence/customise-templates/
Third-Party Reporting Software
There are a number of third-party software options available to assist organisations report and showcase their data.
Applications such as Canva provide templates for infographics or glossy reports. Here is an example of a report we created using Canva.
We are often asked about how to connect to data visualisation applications such as Microsoft PowerBI or Tableau or YellowFin.
There are two approaches to connect SmartyGrants and Power BI:
Using scheduled reports (Excel) and Microsoft 365 to build a data pipeline to Power BI
Connecting Power BI directly to the SmartyGrants APIs
Guides are available for each of these approaches, please contact service@smartygrants.com.au for a copy of the guides.
Note: The SmartyGrants APIs were designed for systems integration rather than reporting, and there are some limitations with regards to data coverage and usability. We are currently working on an interface that is designed specifically for reporting (using OData). In the meantime the recommended approach is to use scheduled reports.
Below we have provided some simple instructions on how to connect the All Fields report to Microsoft PowerBI as an example of how you may connect to Third-Party software.
Connecting All Fields to Microsoft PowerBI
Save your data report securely in a OneDrive or on Sharepoint or other location. If you want to use the data we have used for this example download the All Fields xls below
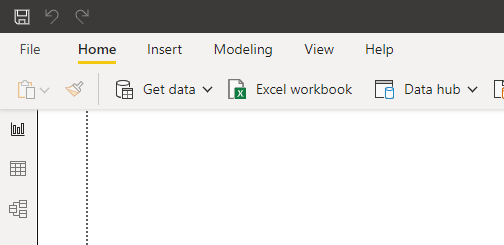
2. Open the Microsoft PowerBI desktop application (downloadable from Microsoft).
3. In the top left-hand corner select Excel workbook
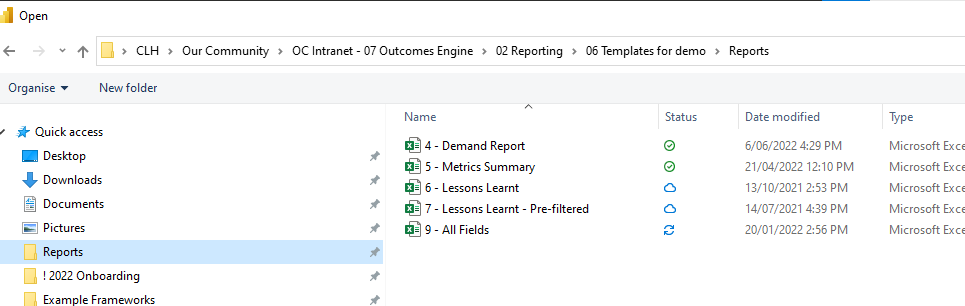
4. Select the All Fields report from your Windows Explorer
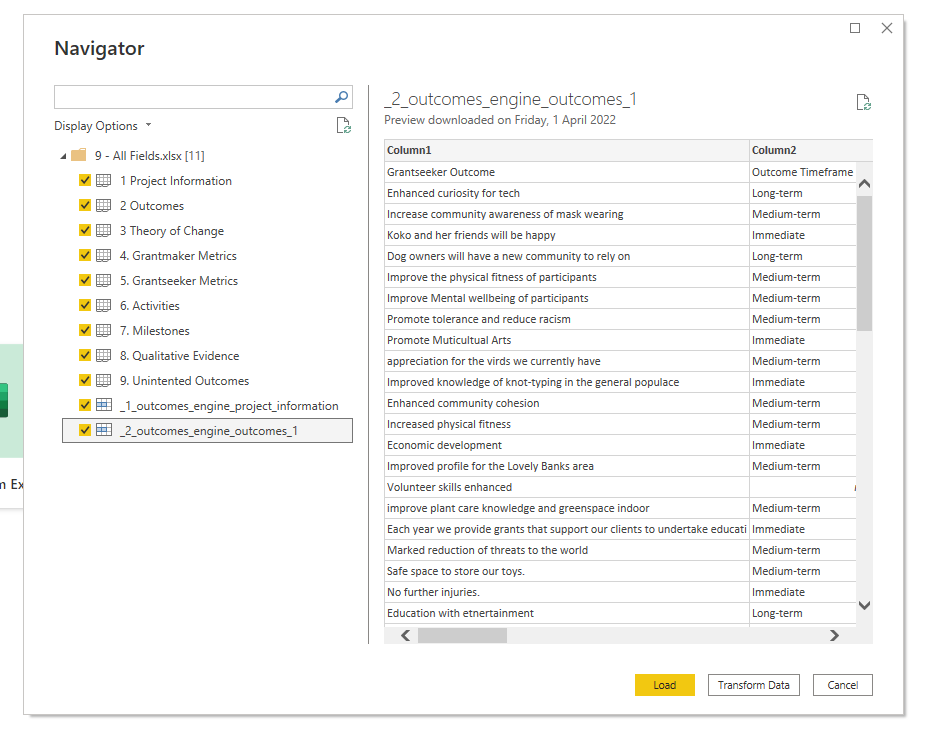
5. Select all the sheets in the Navigator and select Load.
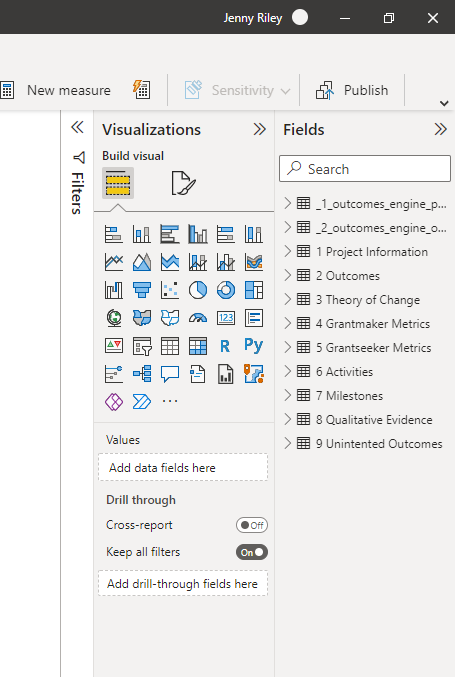
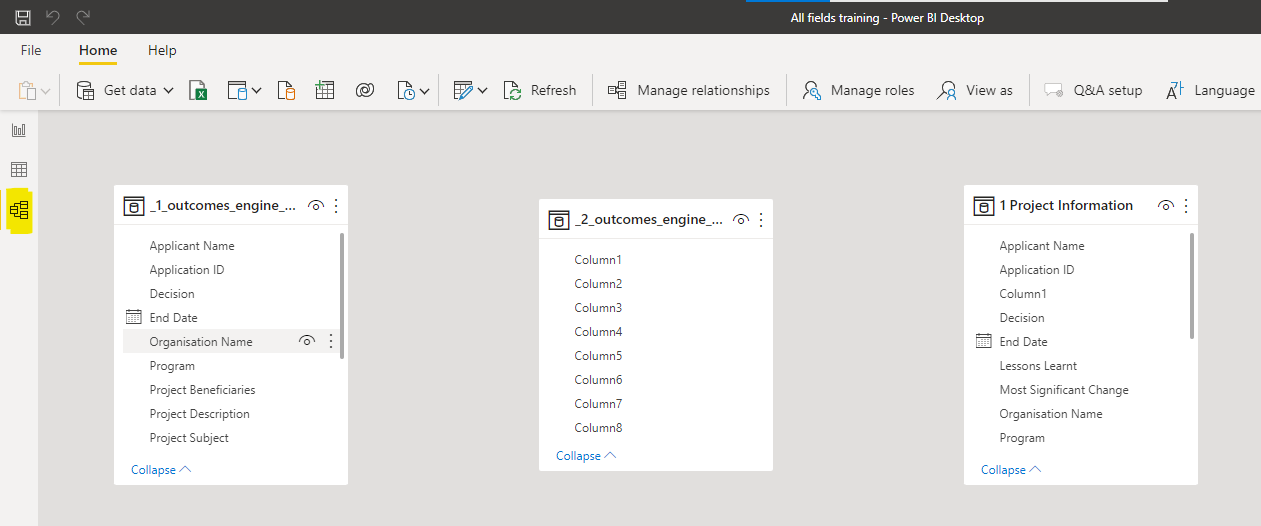
6. You will see all the sheets and fields now appear to the right of the screen.
7. Save your work! (Go to the File Menu and select Save As)
How do I make a dashboard?
First, make sure that your data model is set up by going to the third option down on the left-hand menu called “Model”
2. Select the Project Information table by clicking on it and then select manage relationships from the top menu.
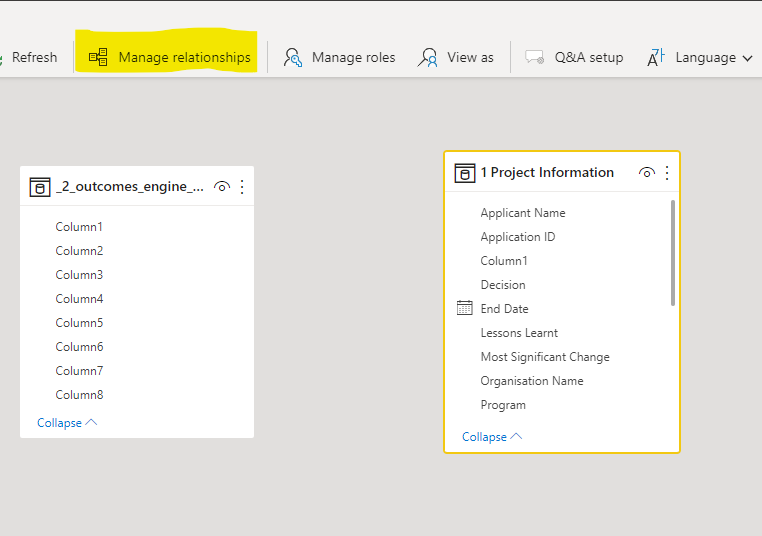
3. Select New…
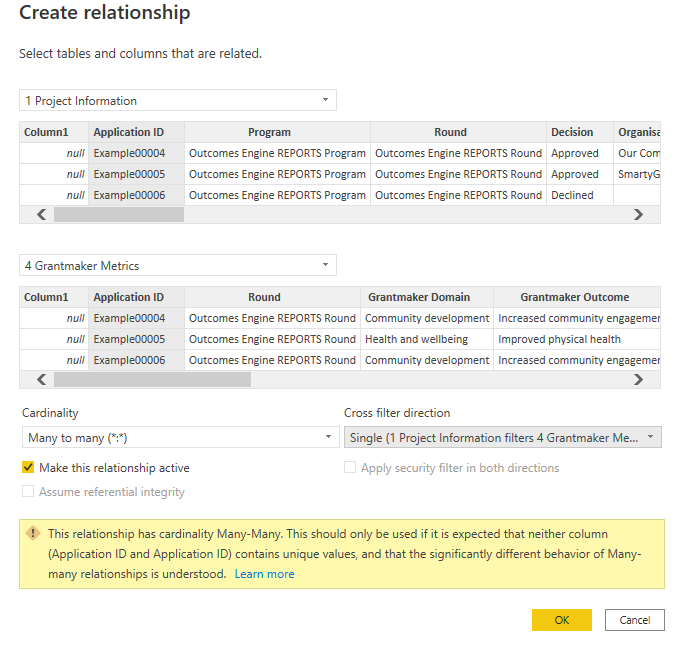
4. In the first drop down menu select Project Information and select the column ApplicationID and in the second drop down select Grantmaker Metrics and highlight ApplicationID. In Cardinality select Many to Many and hit OK.
5. Select Close.
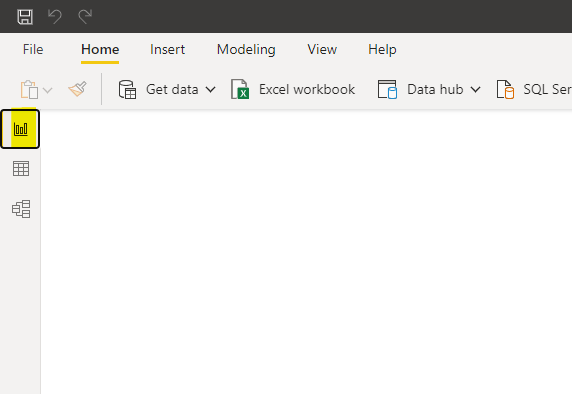
6. Return to the Report page by selecting the Report icon on the left-hand menu.
7. Select your first visualisation type from the Visualisation menu on the right by clicking on “Stacked column chart”
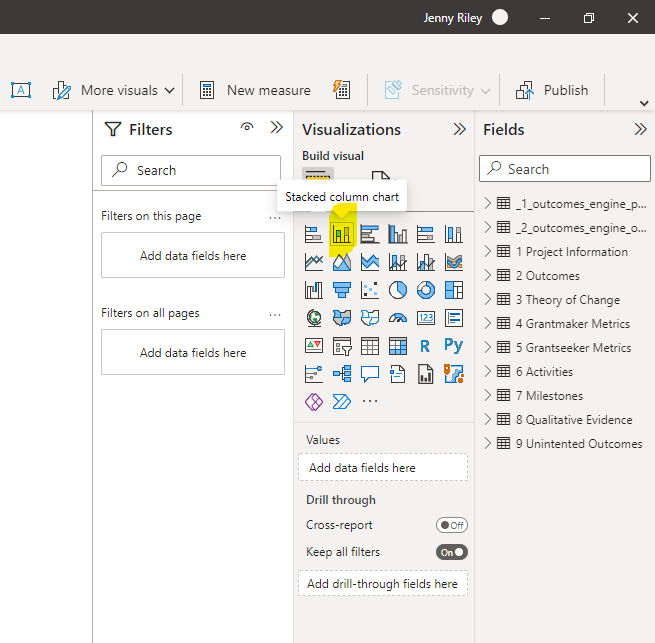
8. A grayed-out visual will appear as a ‘Tile’ on the ‘Canvas’. You can drag this to where you want.
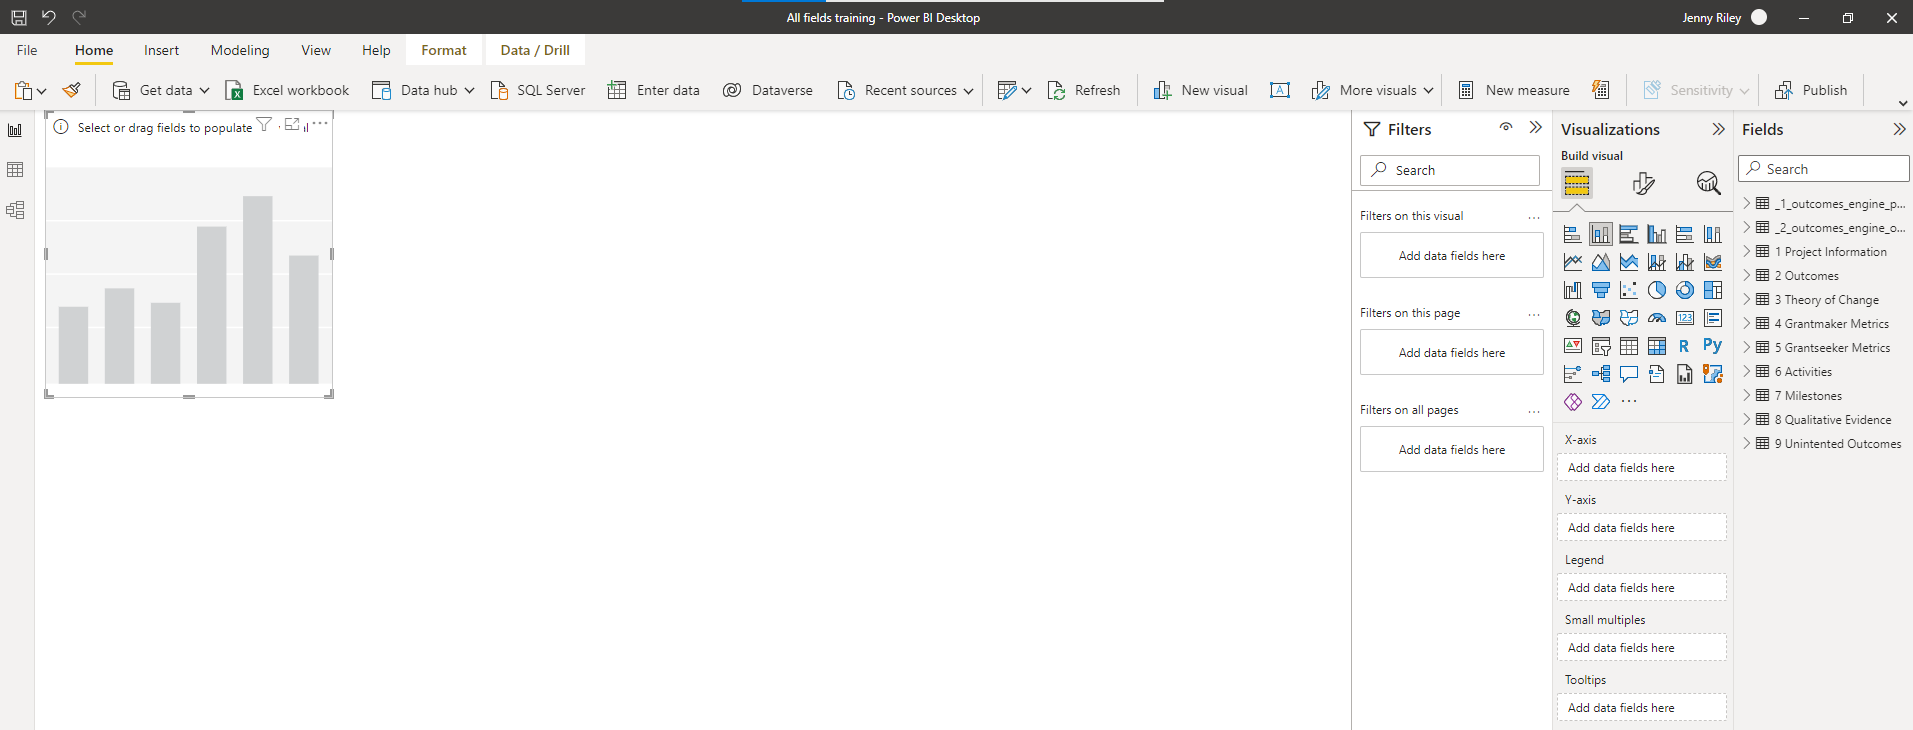
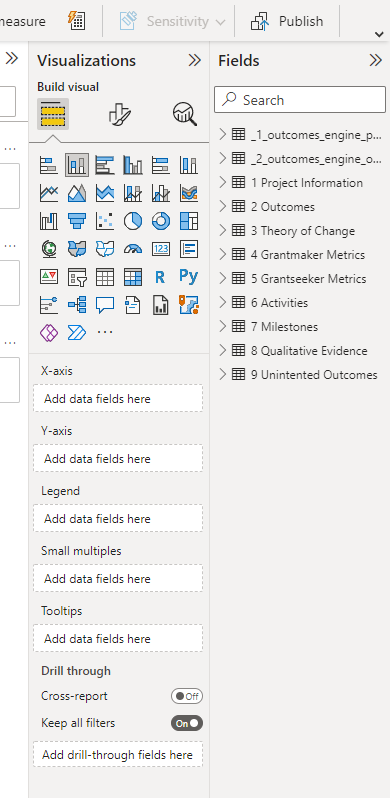
9. To tell PowerBI what you want to see in that visual you use the Build Visual and Fields menus on the right.
10. Select the 4 Grantmaker Metrics drop-down and select the “ApplicantID field”.
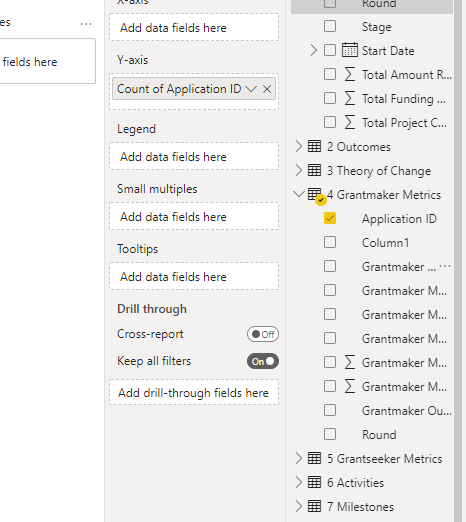
11. Drag this into the Y-axis box.
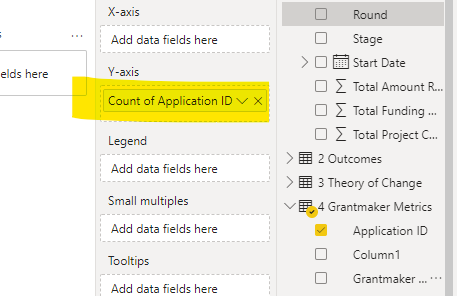
12. Then select Grantmaker Domain.
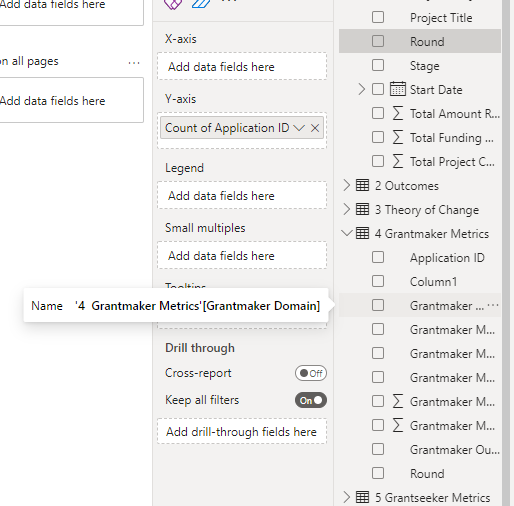
13. Drag this to the X-axis box.
14. Note the change to the visualisation.
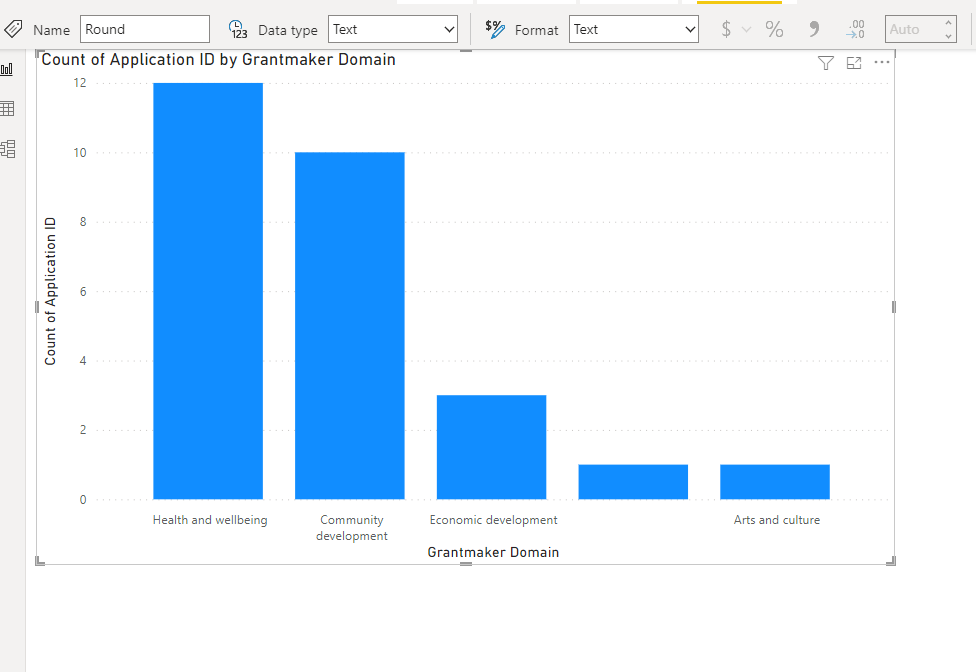
This shows you how many applicants are reporting outcomes in each of your outcome domains. This graph is also useful for helping you ‘sort’ the other graphs - see step 19.
15. To make the visual smaller grab the bottom right-hand corner of the image and pull towards the top left. Select off the visual by clicking anywhere on the canvas. Now you can do another visual.
17. Select Stacked Column Chart again, this time drag Grant Maker metric to the X-axis and Grantmaker Metic Progress and Grantmaker Metric Target into the Y-Axis.
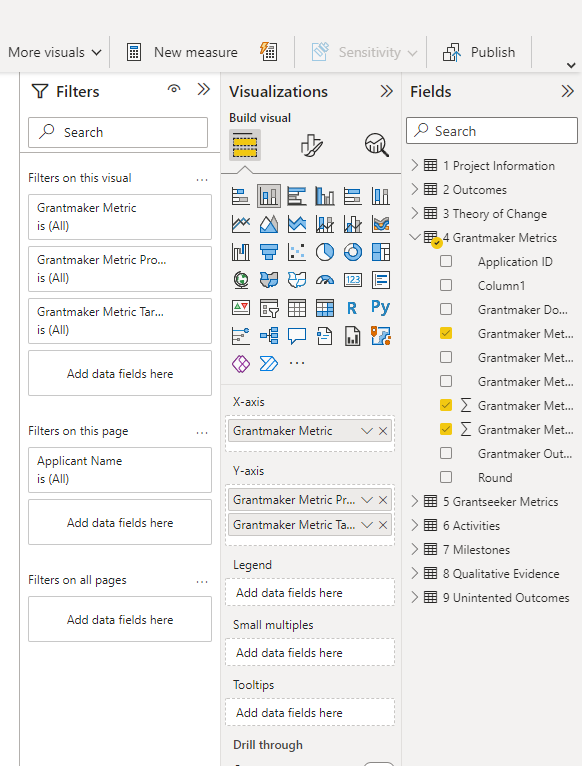
18. Your visual should look like this:
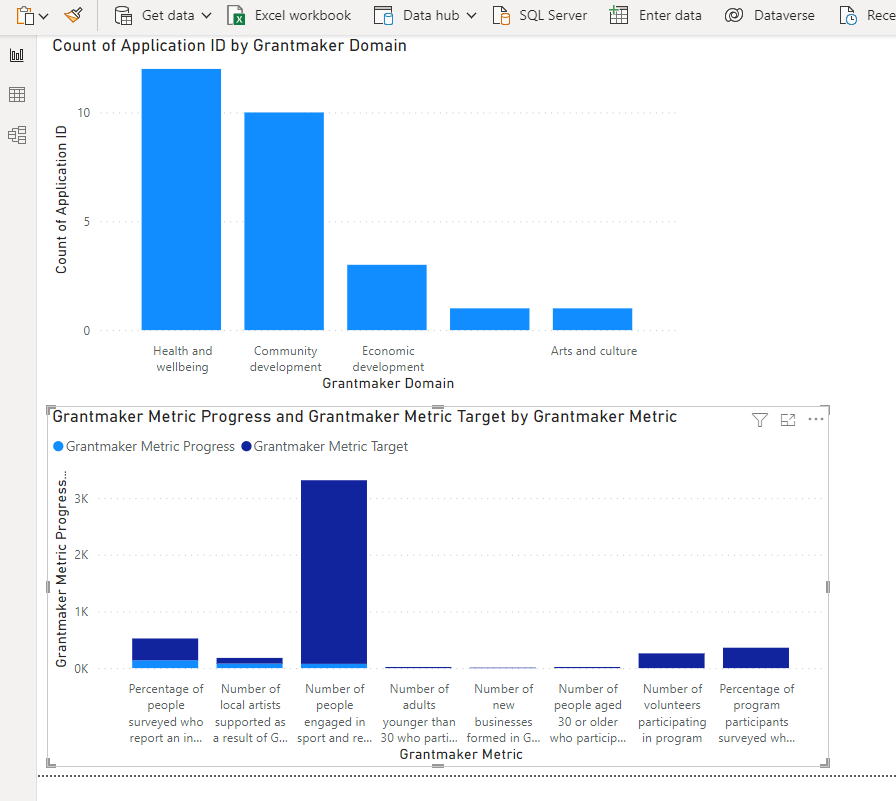
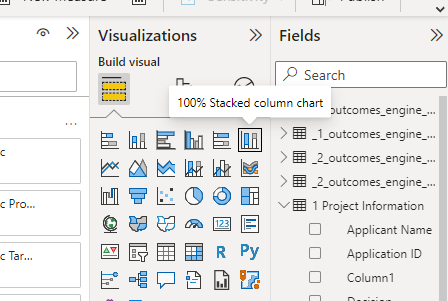
So what does this tell you? So far your grantmakers have yet to reach their targets! If you want to see these as percentages simply select the 100% Stacked column chart visualisation
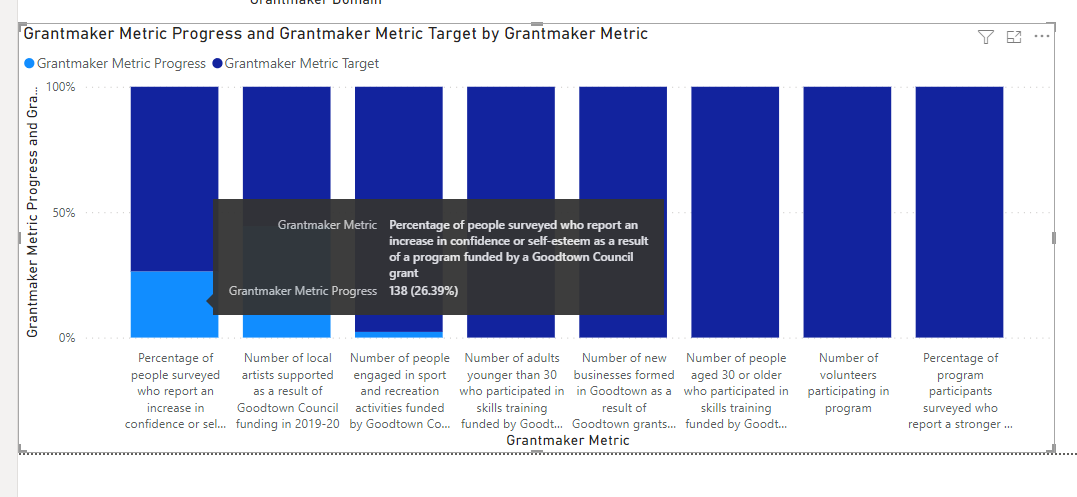
Your visual should update, not if you hover over parts of the graph you will see a tool tip. We can report that 26.39% of people surveyed (so far) have reported an increase in confidence or self-esteem as a result of this grant.
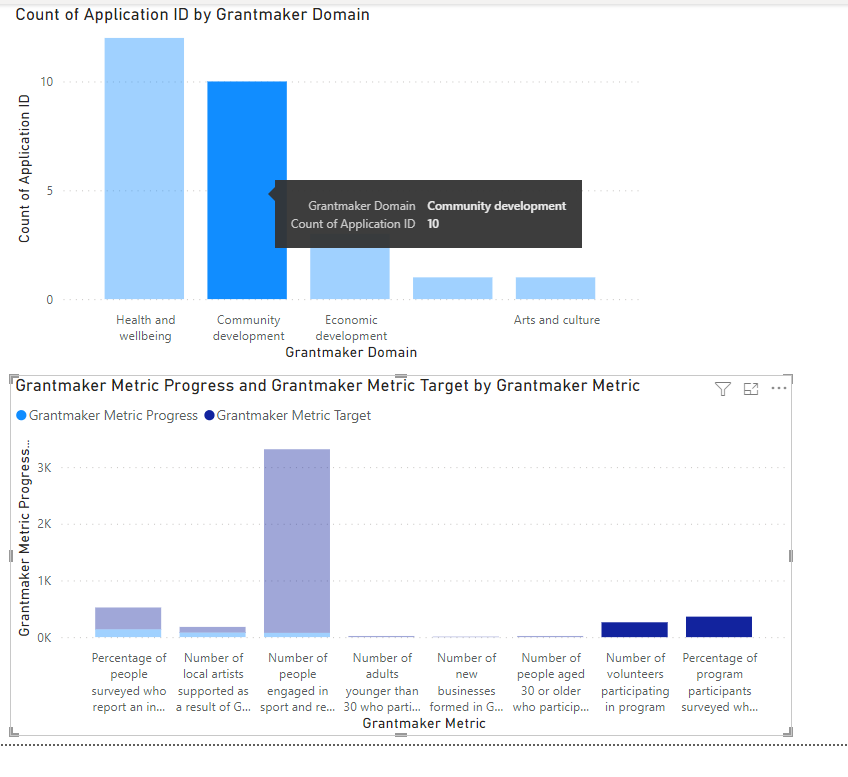
19. Note that if you select one of the domain columns in the top visualisation it will sort the relevant data in the second visual.
20. Great you say but I want to know which of my grantees is providing the outcomes. On a new page select a stacked bar chart. Drag the Applicant Name (from Project Infomation table) into the Y-Axis and Grantmaker Metric Progress and Grantmaker Metric Target into the X-Axis.
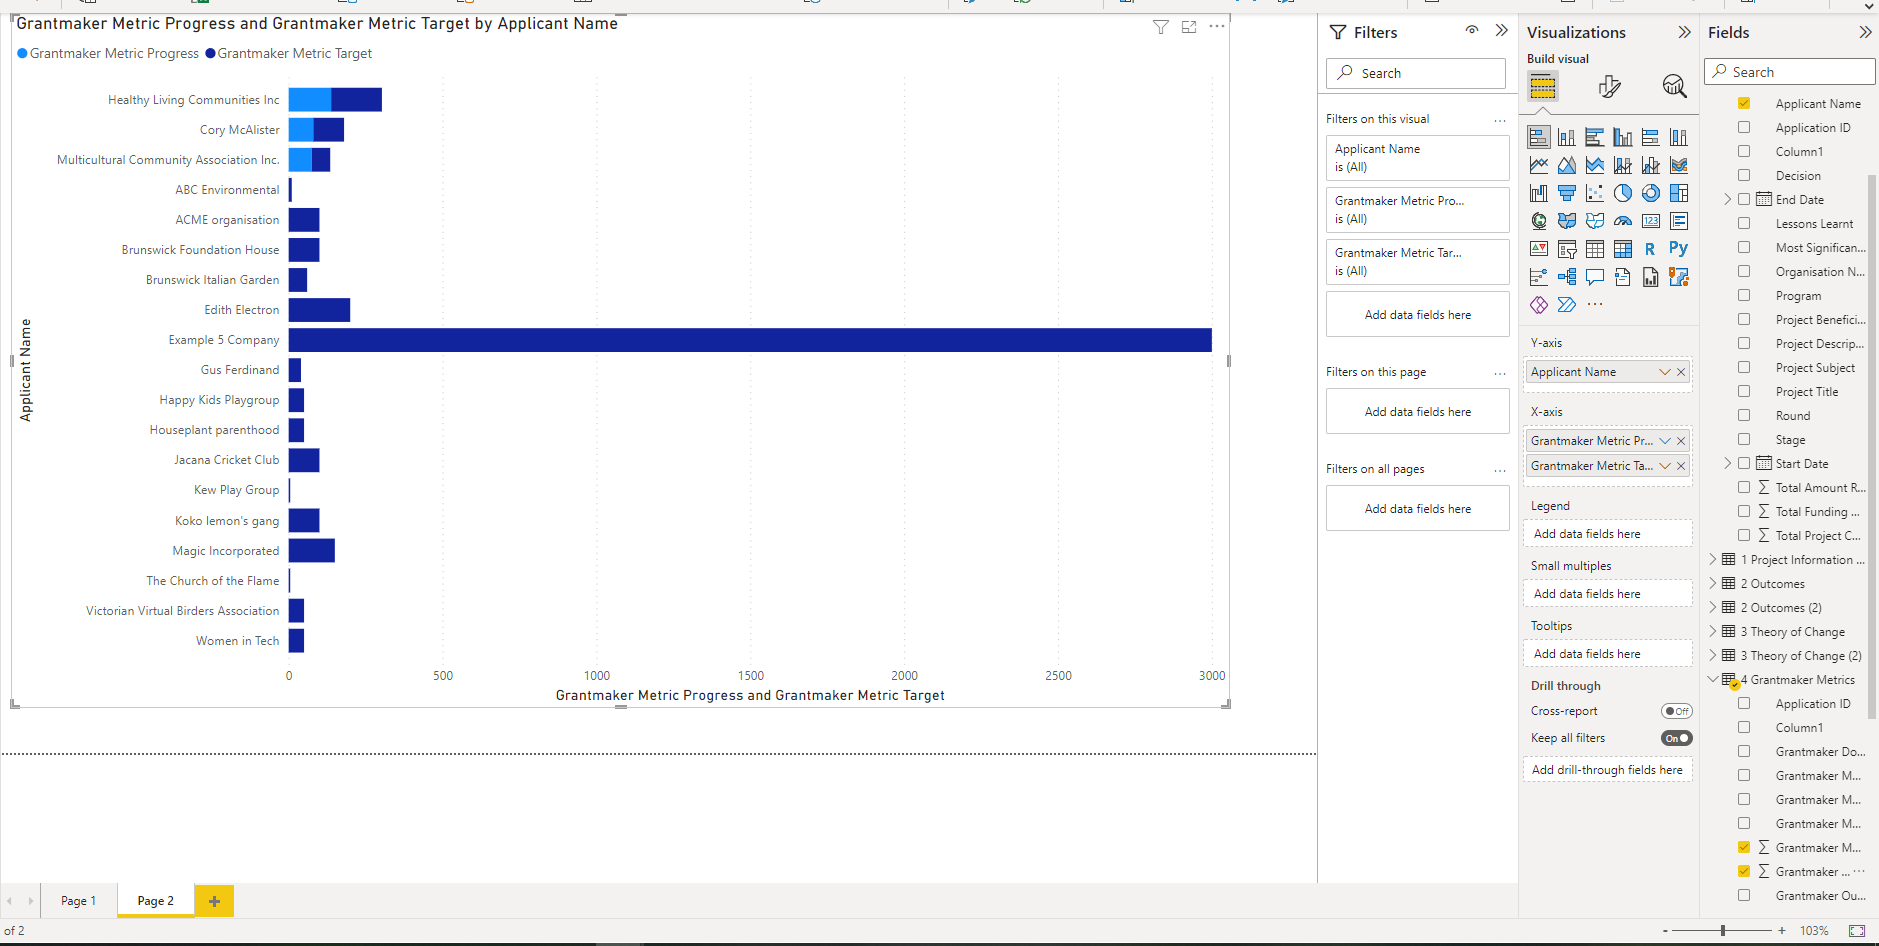
There is so much more you can report. We will keep adding ideas and tricks and tips on this page. Best thing is to start exploring your data!
Further help
Contact service@smartygrants.com.au to talk to our consulting team to discuss services to create tailored reports for you.